The physical environmental condition.
(Case study 03)Heat & Human Behavior
Behavioral Science · Experimental Design · Quantitative Analysis
The room was hot.
But the experience
mattered more.
I examined whether subjective thermal experience—especially thermal comfort—was more consistently related to emotion and task performance than objective temperature alone.
(01)Research question
Do people respond to heat itself—or to how hot and uncomfortable it feels?
The sensory experience of how hot or cold the environment seems.
The evaluative experience of whether that sensation feels acceptable or aversive.
Conceptual framework · Not a tested mediation model
Environment→Subjective experience→Affect→Performance
Stress-appraisal research suggests subjective evaluation may be a more proximal correlate of emotional response than the external stressor alone. The full causal pathway above was not formally tested.
(02)Experimental design
Every participant.
Every condition.
Twenty-six participants, ages 18–32, completed all three conditions in randomized order. Each condition lasted approximately 60 minutes.
TEMP
One condition · Repeated across all three temperatures01T0 02Task 01 03T1 04Task 02 05T2 06Task 03 07T3
Thermal experience + affect
Backward Digit Span · working memory
Thermal experience + affect
Stop Signal Task · inhibitory control
Thermal experience + affect + anger
RC-RAGE · response to provocation
Thermal experience + affect
(03)Measures
Four layers of
human response.
The study separated the environment, sensory and evaluative experience, emotion, and motivated performance rather than collapsing them into one outcome.
Perceived temperature
Thermal comfort
Sensory intensity versus evaluative acceptance.
Positive
Negative
Active · at ease · happy · calm · motivated · refreshed
Anxious · annoyed · tired · gloomy · bored · hostile
Working memory
Inhibitory control
Response to provocation
Backward Digit Span · Stop Signal Task · RC-RAGE
Total bonus
earnings
A behavioral index of motivated task performance—not a pure measure of intelligence or ability.
(04)Analytic strategy
Model the structure
the data actually has.
Repeated observations from the same person are not independent. Linear mixed-effects models accounted for within-person dependence with participant ID as a random intercept.
01Repeated observations→
02Nested within people→
03Mixed-effects models→
04Linear + quadratic tests→
05AIC model comparison
Fixed effects varied by model
Condition · time · perceived temperature · thermal comfort · affect
Thresholdα = .05
ToolsPython · pandas · statsmodels
(05)Results
A clean manipulation.
A nuanced response.
Significant, null, nonlinear, and interaction findings are all shown because the mixed pattern is the research story.
(05.1)
Manipulation check
The temperatures felt meaningfully different.
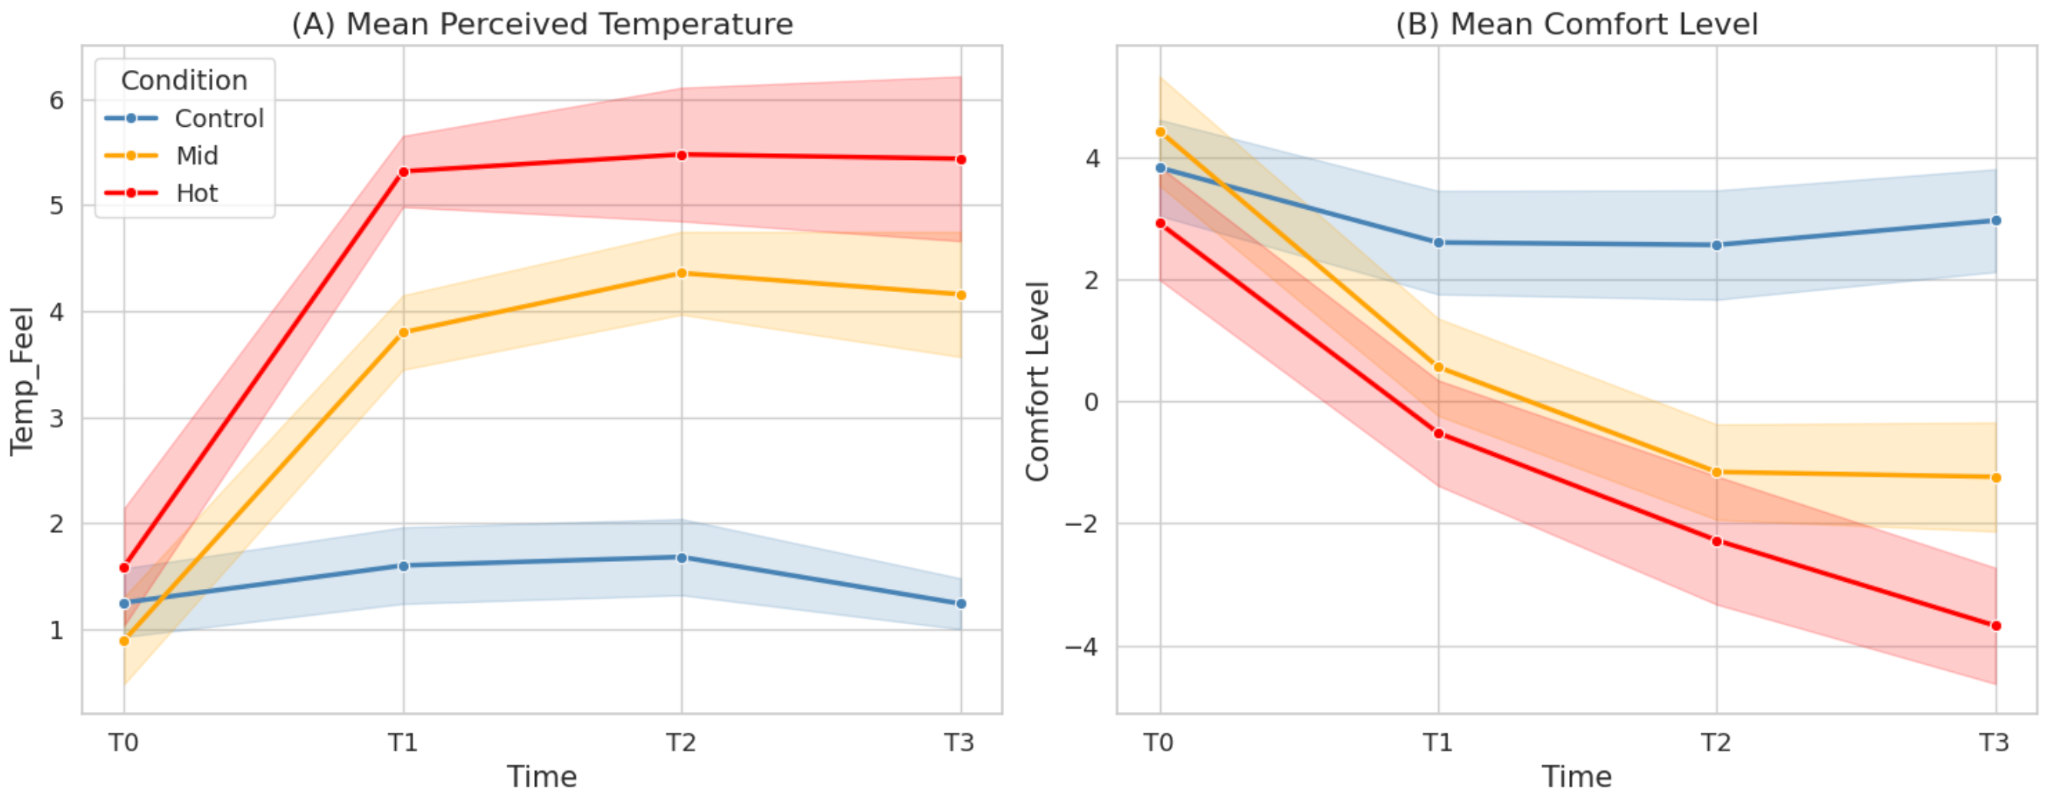
Both heat conditions significantly increased perceived temperature and reduced comfort relative to control (all p < .001).
Allowing condition effects to vary by participant substantially improved the comfort model (ΔAIC = 55.88), showing meaningful individual differences: the same temperature did not feel equally comfortable to everyone.
- Moderate: perceived heat b = 1.98 · p < .001
- High: perceived heat b = 3.11 · p < .001
- Moderate: comfort b = −2.58 · p < .001
- High: comfort b = −3.84 · p < .001
(05.2)
Subjective experience
Feeling hot was not the same as feeling uncomfortable.
Perceived temperature“How hot does it feel?”
Thermal comfort“How acceptable or aversive does it feel?”
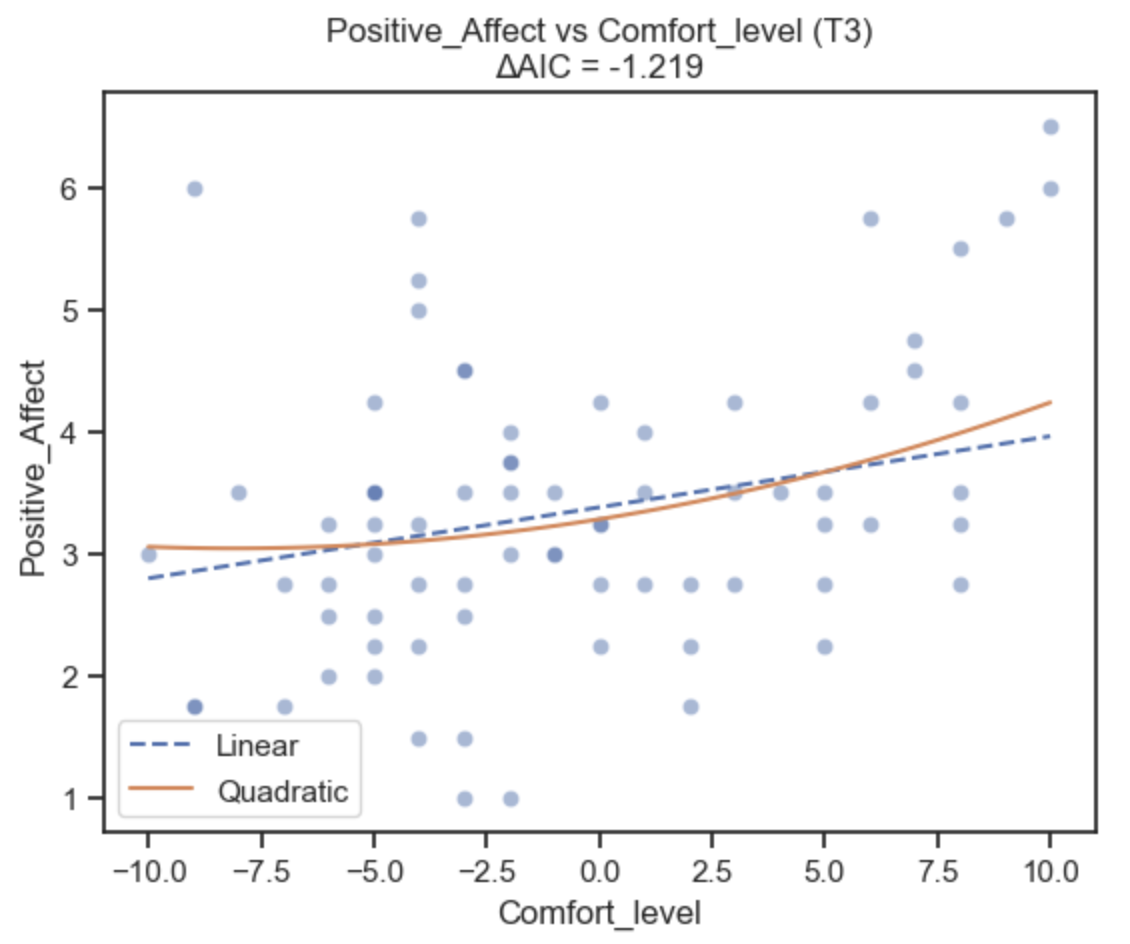
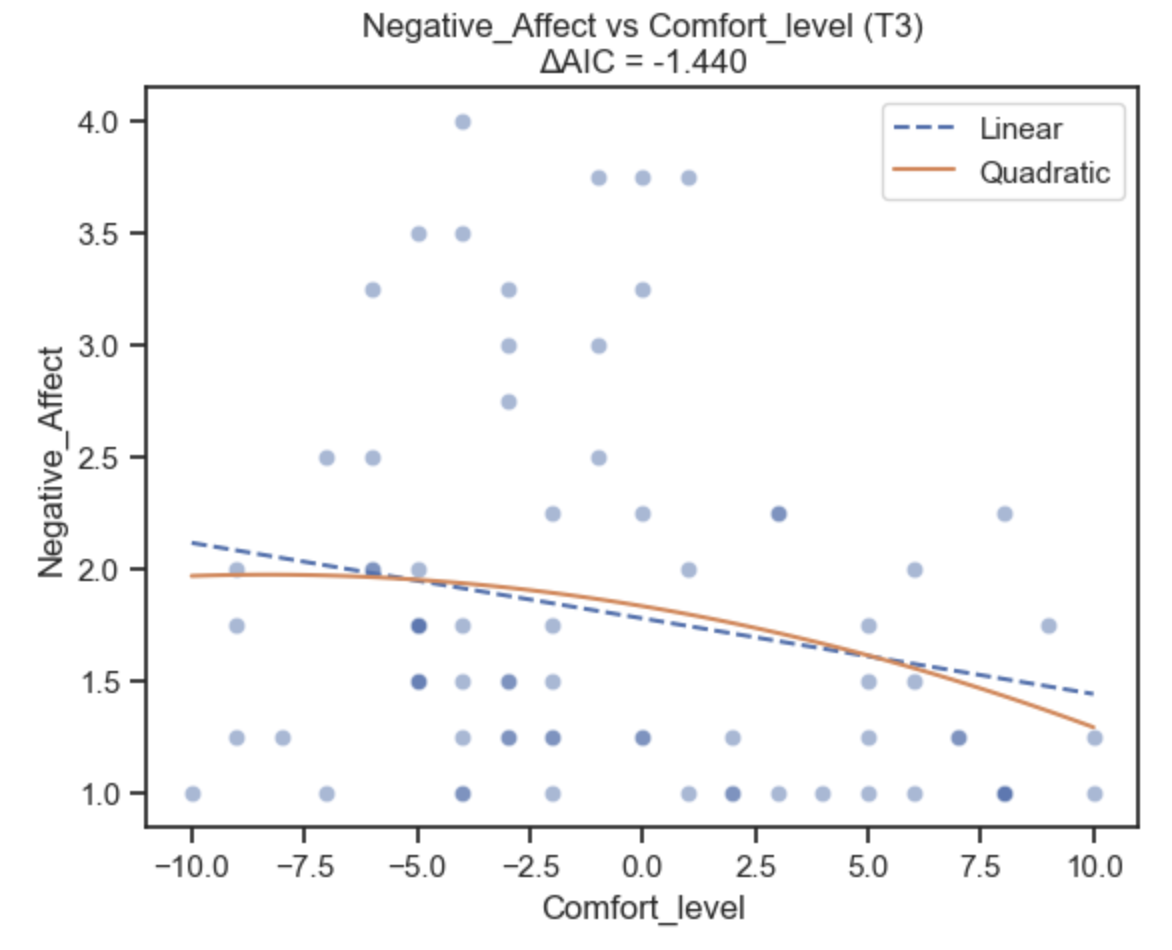
At T3, higher thermal comfort was associated with higher positive affect and lower negative affect. Within this sample, comfort tracked affect more consistently than objective condition—and did so monotonically.
- Positive affect: b = 0.058 · p = .004
- Negative affect: b = −0.034 · p = .012
- Linear fit outperformed quadratic fit
(05.3)
Nonlinear result
More perceived heat did not map onto emotion in a straight line.
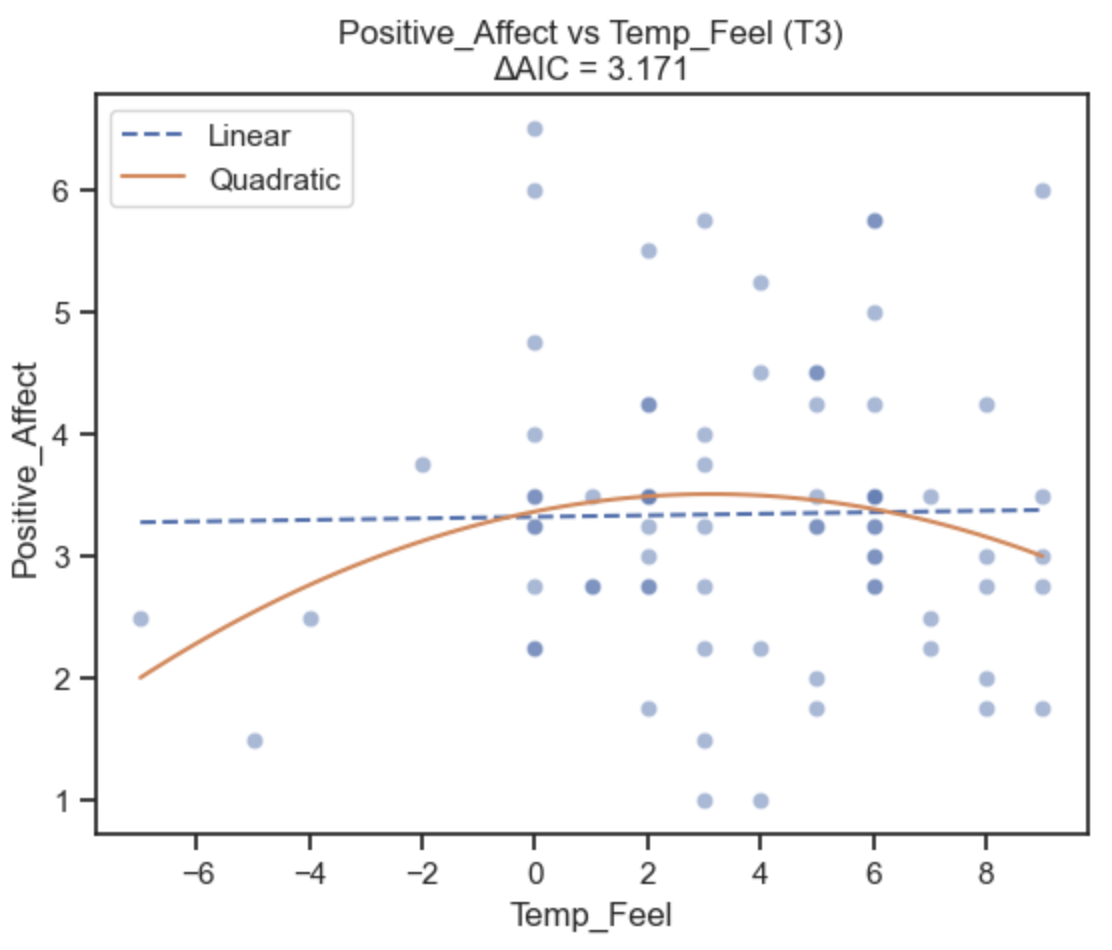
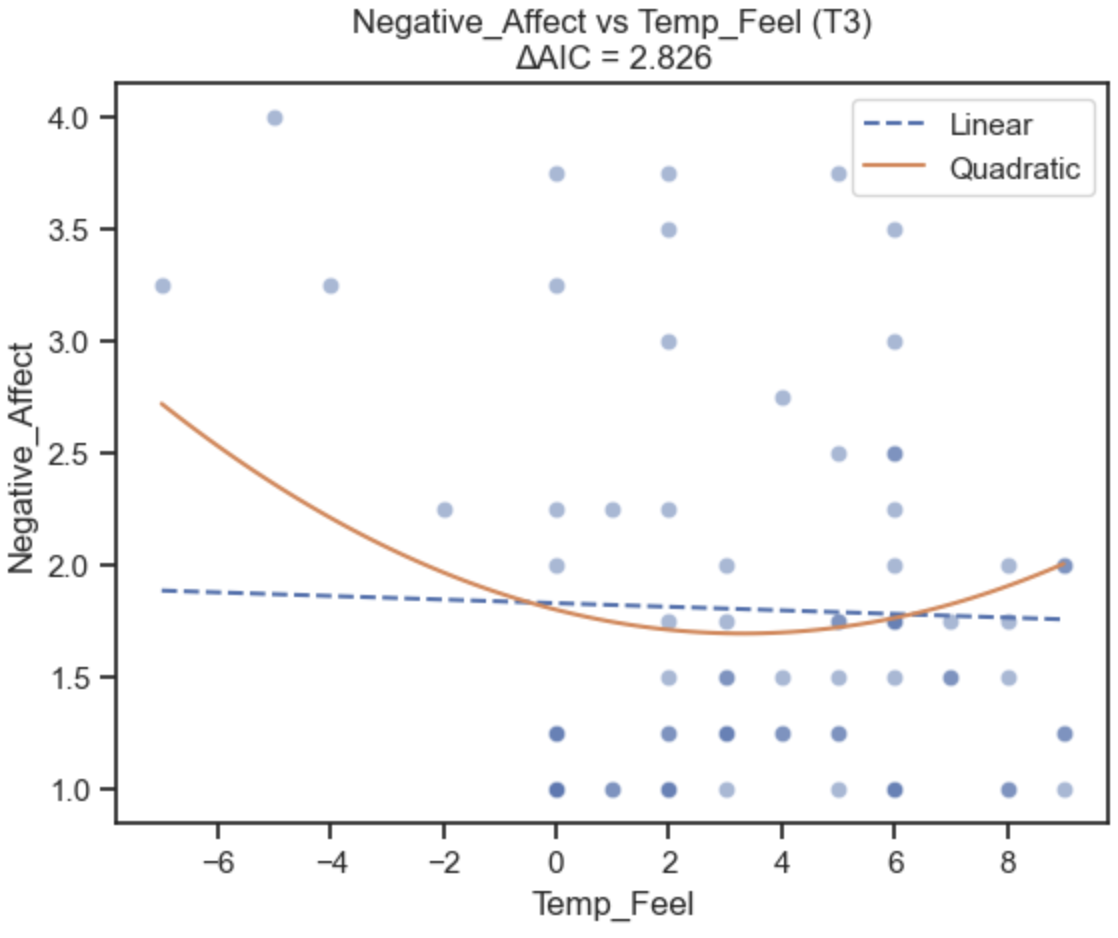
No significant effects appeared at T0 or T1. Later in exposure, affect appeared most favorable around moderate perceived-temperature levels: an inverted U for positive affect and a U for negative affect. This is a tentative pattern within this sample—not a universal comfort zone.
- T2 positive affect quadratic p = .024
- T3 positive affect quadratic p = .022
- T3 negative affect quadratic p = .029
- T3 ΔAIC = 3.17 / 2.83
(05.4)
Mixed + null result
Objective heat changed experience more clearly than emotion.
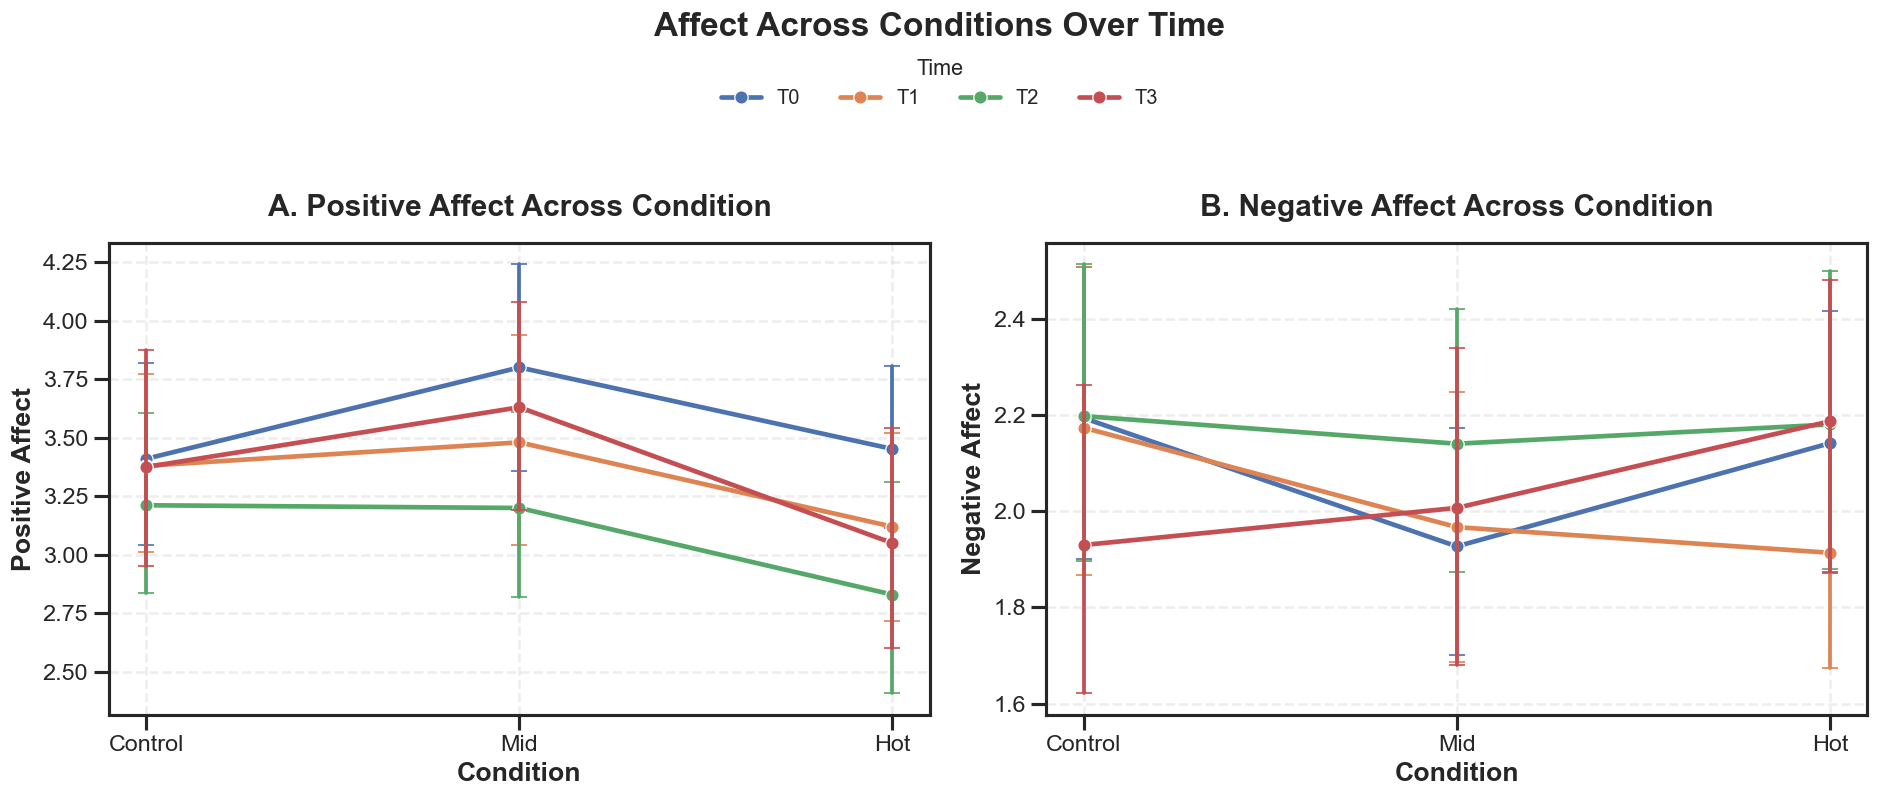
Temperature condition was not a significant predictor of negative affect. Moderate heat—but not high heat—was associated with higher positive affect than control. The direct condition–affect story was limited and inconsistent.
- Negative affect: moderate p = .096
- Negative affect: high p = .801
- Positive affect: moderate b = 0.39 · p = .016
- Positive affect: high p = .794
(05.5)
Performance association
More positive affect was associated with higher overall task earnings.
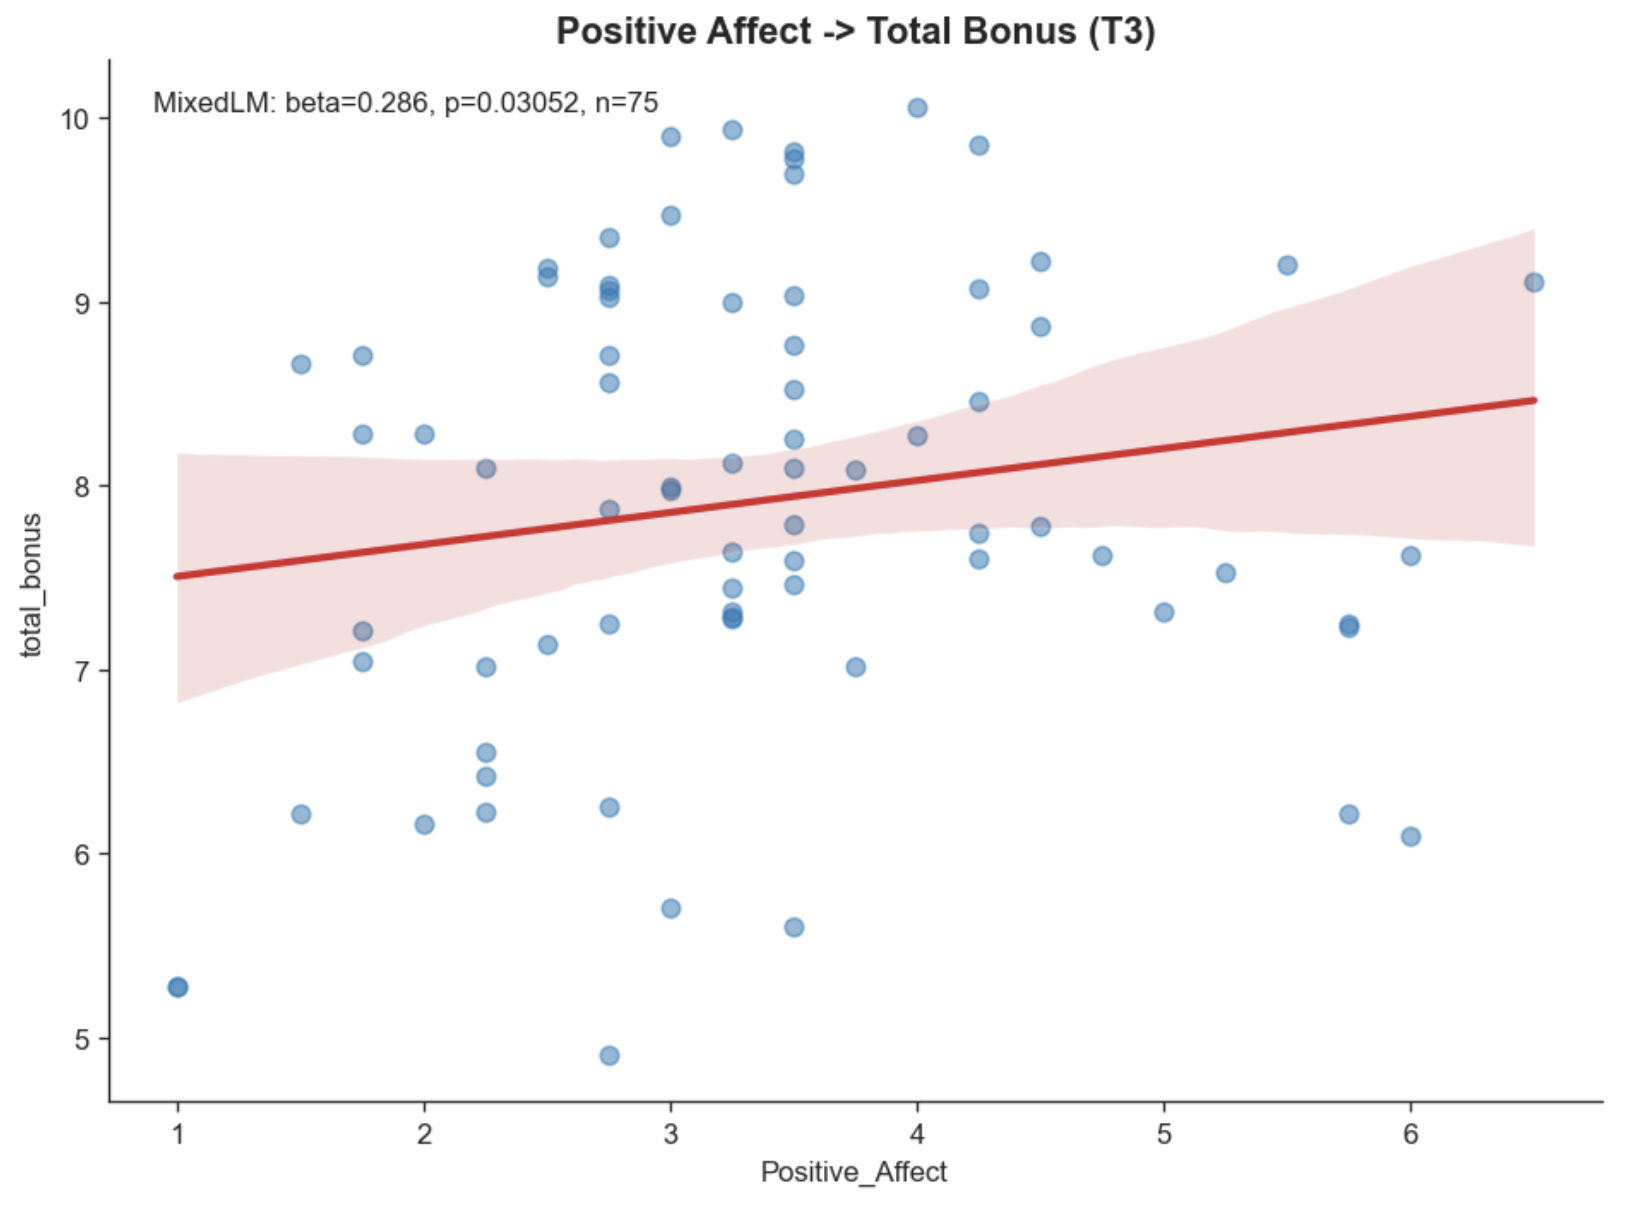
At T3, higher positive affect was associated with greater total bonus. It did not significantly predict performance in any single task, suggesting a broader overall pattern rather than one task driving the association. This result is associative, not causal.
- Total bonus: b = 0.29 · p = .031
- Individual task models: all ps > .16
(05.6)
Condition-specific · Exploratory
Negative affect became more consequential under high heat.
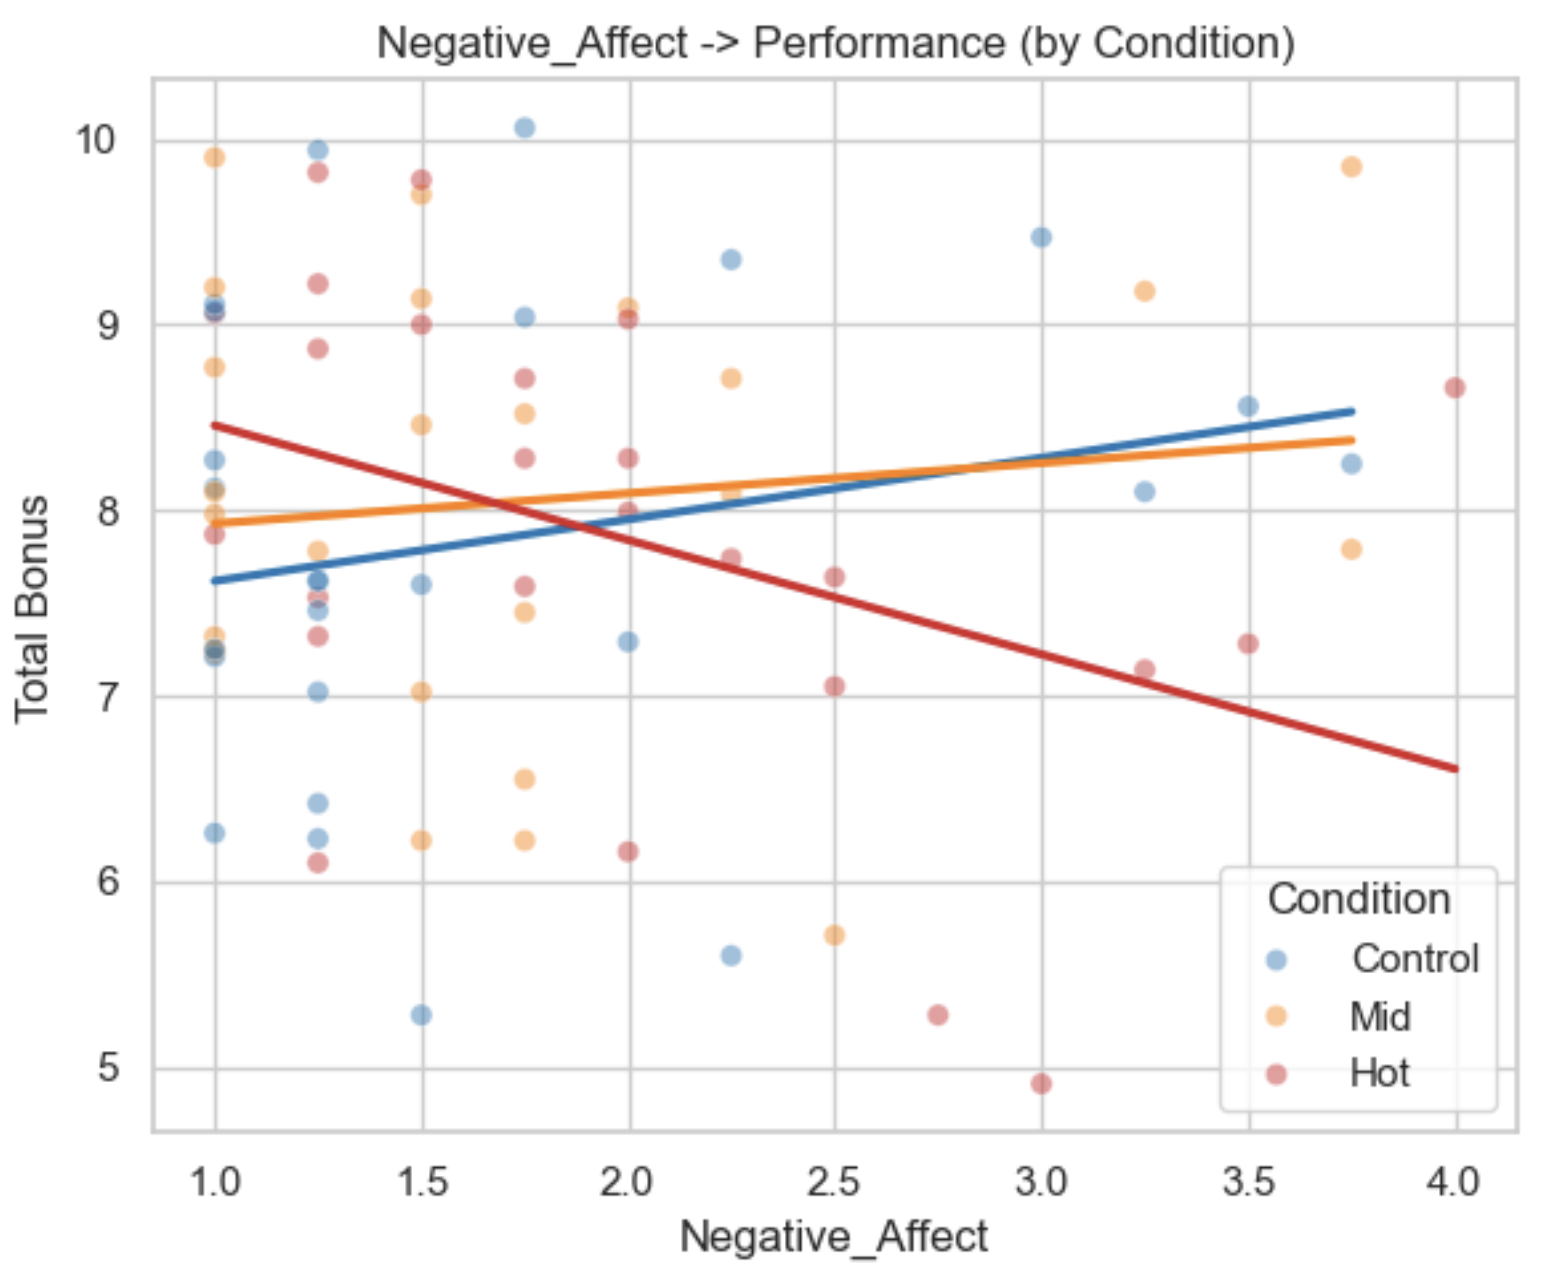
Negative affect was not associated with performance overall. Under high heat, however, higher negative affect was associated with lower performance; no comparable relationship appeared in control or moderate heat. Given N = 26, this interaction should be interpreted cautiously.
- Overall negative affect: b = 0.06 · p = .754
- Negative affect × condition: β = −0.95 · p = .030
(06)Synthesis
The thermostat does not tell the whole psychological story.
Objective temperature
↓Clearly changed perceived heat and comfort
Thermal comfort
↓Was more consistently associated with affect
Affect
Related to performance in specific, context-dependent ways
(07)Implications & rigor
Two people can share a temperature without sharing the same experience.
Within this sample, thermal comfort was more consistently associated with affect than objective condition alone. Environmental stress may be better understood by considering both the external condition and how it is subjectively experienced.
Practical implication · Not tested intervention
Improving environmental experience may involve more than lowering air temperature. Air flow, humidity, and personal control are thesis-supported possibilities for future study—not tested solutions.
Future work
Larger, more diverse samples · real-world thermal environments · skin temperature or heart rate · formal mediation testing · deeper study of subjective and physiological response.
Sample
N = 26 limited power and generalizability.
Lab setting
Controlled exposure may not represent real-world heat.
Performance
Bonus earnings may combine ability, effort, and engagement.
Experimental context
Chamber and task setup may have shaped experience.
Exploratory findings
Interactions require cautious interpretation.
(08)Research outcome & reflection
Exposure,
sensation,
evaluation.
I distinguished three components often collapsed together: objective temperature, subjective thermal sensation, and thermal comfort. They did not relate to affect in the same way; comfort was the more consistent correlate, perceived temperature showed nonlinear effects, and objective condition had limited direct associations.
This project reinforced the importance of separating environmental exposure from subjective experience. A clean manipulation does not guarantee a simple psychological response; the most informative question became not only where participants were, but how they experienced it.
The project taught me to test the structure behind an intuitive story instead of forcing the data to fit it.